
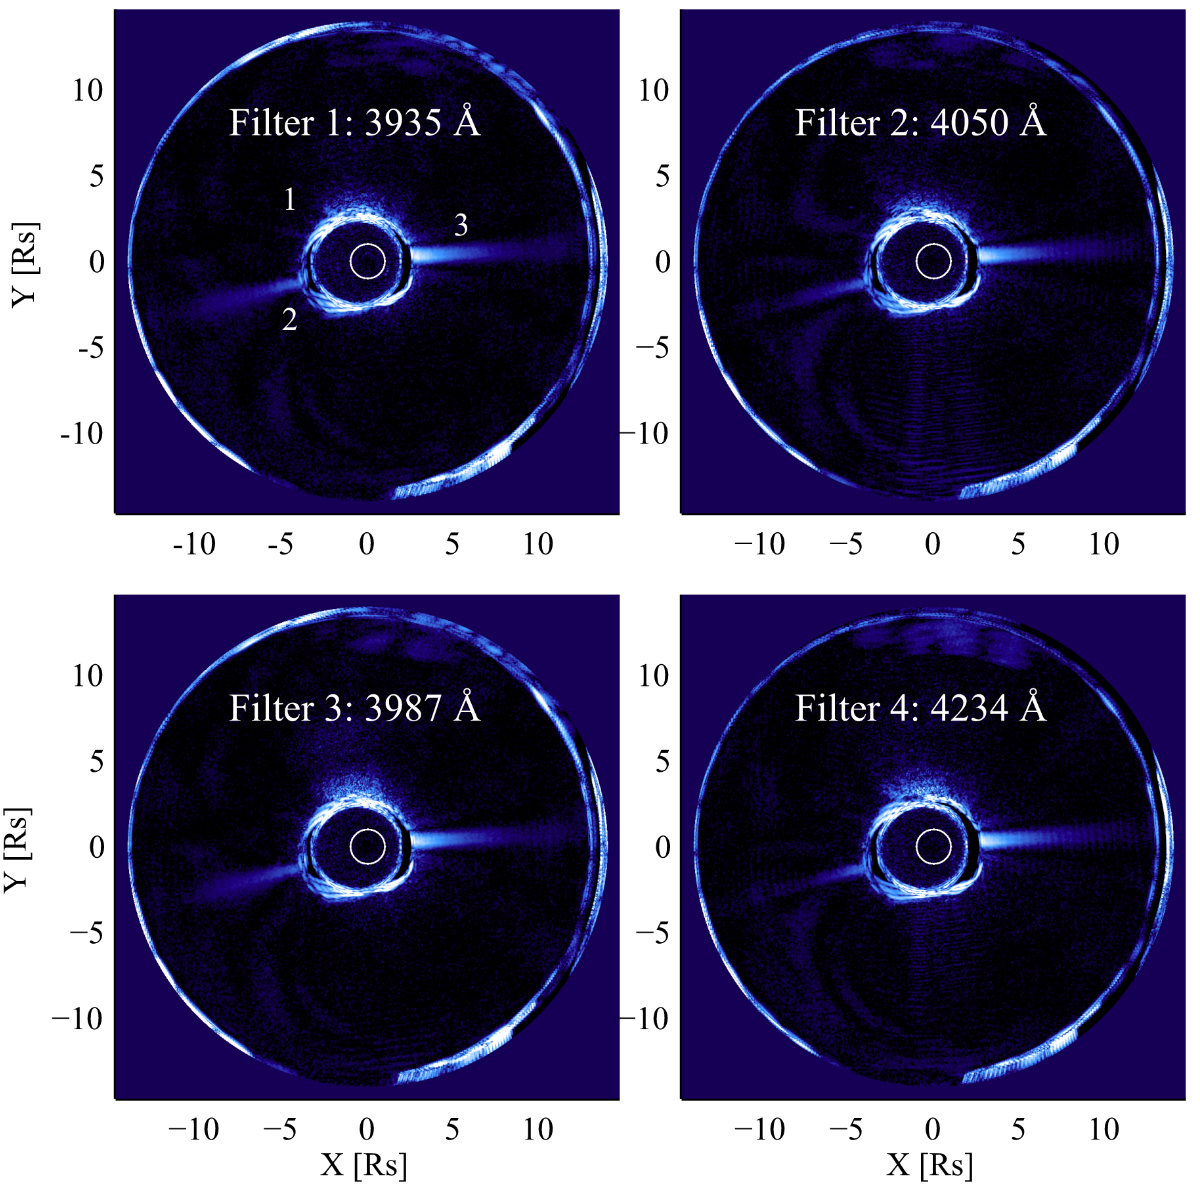
Even though the sky looks dark at float altitude, there is still significant sky brightness level. The diffraction stray light also equally contributes to the background. Since we need to measure the polarization brightness to isolate the K-corona, we made use of the field rotation to isolate the signal from the streamer. We co-added 30 sets of images to obtain the pB images. BITSE was launched at the end of solar cycle 24, so the corona has a simple structure with equatorial streamers above both limbs (marked 2 and 3). There was an additional thin streamer at the location marked 1, but this streamer is not discernible in the BITSE image. The offset between the occulter image (BITSE pointing center) and the optical disk was introduced in the beginning of the observations to make the features look symmetric. This makes the western streamer observed well from 3 Rs onwards, while the eastern streamer correspondingly was observed only from ~4 R_sun. For these reasons, we primarily use the western streamer in determining the temperature and flow speed of electrons.
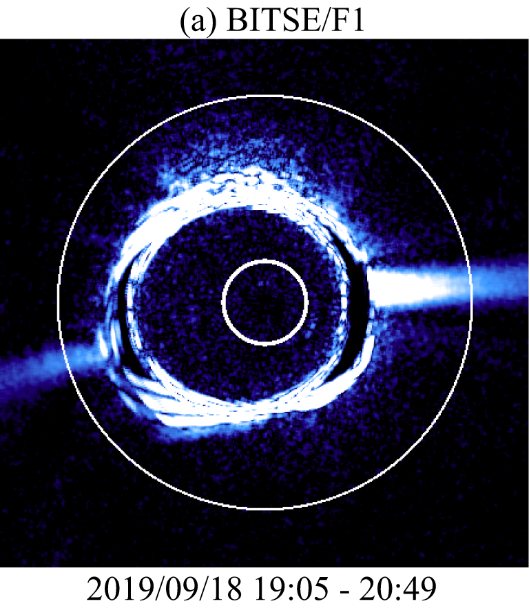
A background-subtracted BITSE/F1 pB image was compared with a LASCO/C2 pB image, from which a monthly minimum background has been subtracted. The polarized brightness plotted against the position angle (PA) at a heliocentric distance of 5 Rs, shows the streamers 2 at PA~100⁰ and 3 at PA ~270⁰. Streamer 1 at PA ~70⁰ is discernible in the LASCO/C2 image, but not in the BITSE image. There is a hint of streamer 1 in the BITSE image, but almost at the background level. The LASCO/C2 image also shows polar plumes. The BITSE dynamic range is not high enough to show the polar plumes. However, the narrow streamer observed by BITSE is in good agreement with the geometric properties obtained by SOHO/LASCO in the overlapping physical domain.

.png)
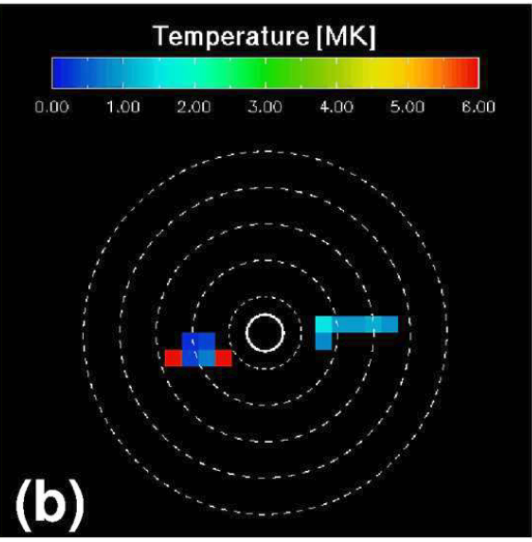
Since we have four data points on the spectrum, we can compare the observed spectrum against the theoretical spectrum to see to what T and V values give the best match between the two spectra. The computation of the theoretical K-corona spectrum requires T, V, and density (n) of electrons along the line-of-sight. Assuming T and V to be constant along the line of sight, we model the density distribution of the streamer using a density multiplier. We used a least-squares method to find the best values of T and V for which the observed and expected spectra at each macro pixel (32×32 original pixels) match as indicated by minimum chi-square, the goodness of the fit measure we used in fitting. The signal is not strong enough on the eastern streamer to obtain reasonable T and V values. The western streamer has 5 pixels located approximately at heliocentric distances 3.3 to 6.9 Rs, in steps of 0.9 Rs. The innermost pixel partly overlaps with the region of saturation. The signal is weak in the last two pixels. In the intermediate two pixels at 4.2 R_sun and 5.1 R_sun, the corresponding best T and V values are (1.0 MK, 260 km/s) and (1.0 MK, 290 km/s). When we derive temperature and speed from the ratios (F2/F1, F4/F3) only, the temperature of the western streamer region is at 1.0 MK in the four pixels at 4.2-6.9 R_sun in agreement with what was obtained from spectral fitting. The V values in these pixels are also ~260 km/s, although they have a large uncertainty interval.