

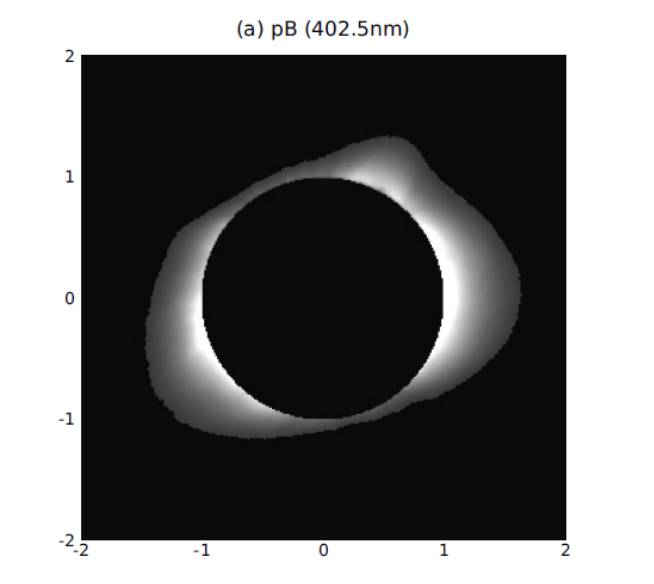
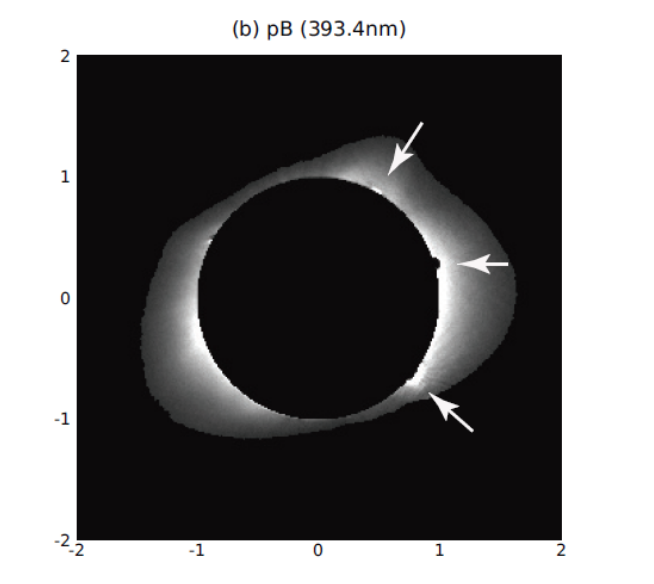
We successfully obtained polarized intensity (pB), polarization angle (pA), and degree of polarization (pD) of the solar corona after stacking five images per polarization. Using the ratio of the polarized intensity at 402.5 nm and 393.4 nm, we constructed a temperature map of the corona. The temperature distribution is consistent with known trends for the eastern limb. Temperatures are higher at the streamer and lower at the boundaries between the streamer and the cool polar corona hole. We observe several structures with consistent shapes along the thread of the streamer. The western limb and southern region display dubious temperatures, probably due to the contamination by light scattering from prominences.

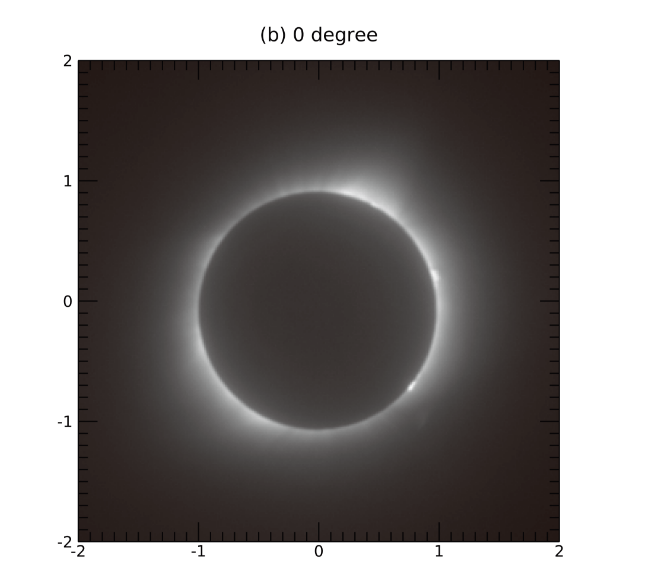

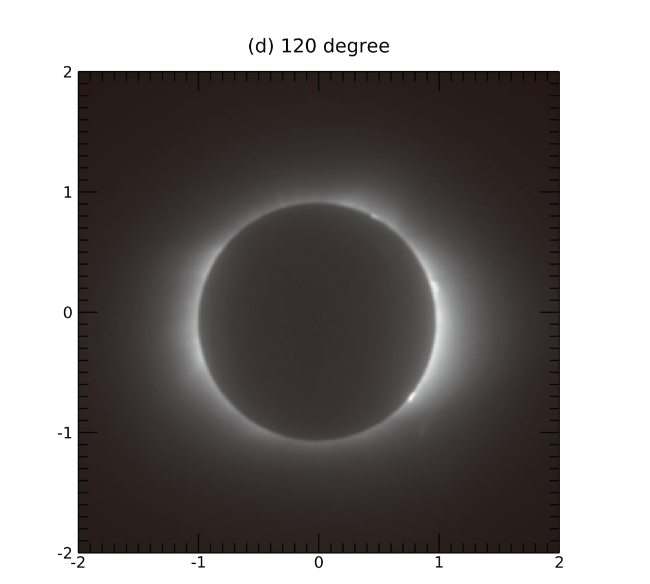


 Coronal continuum intensity image.
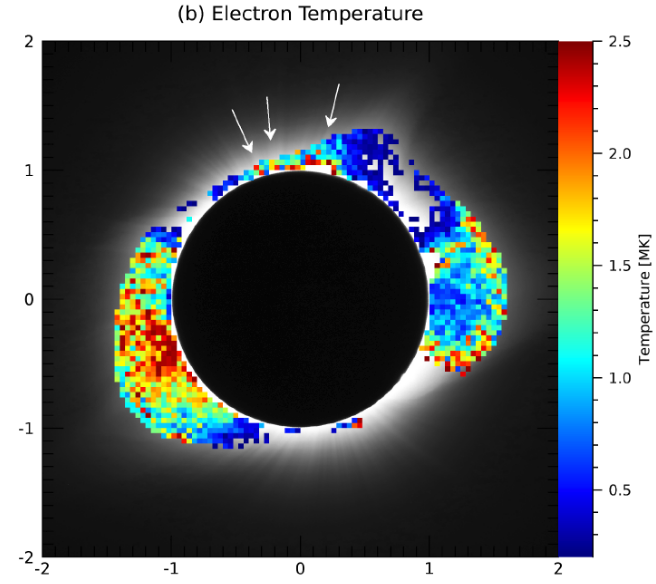 Electron temperature map,
 overlaid on the intensity image.